Hearing the Unspoken: Using Real-Time Classroom Data
to Humanize Learning
Why Real-Time Classroom Data Matters More Than Delayed Benchmark Scores
If a student could articulate exactly why they were stuck, they wouldn’t be stuck in the first place.
Think about the last time you saw a student hit a wall. They rarely raise a hand and say, “Excuse me, I’m struggling with the distributive property because I haven’t quite mastered negative integers.” Instead, they send different kinds of signals. They put their head on the desk. They start a conversation with a neighbor about anything other than the lesson. They stare blankly at a screen, hoping the bell rings before you notice they haven’t moved an inch.
It’s time to change how we talk about those moments. By leveraging real-time classroom data, we can move past seeing “data” as a cold set of numbers and start seeing it as a powerful storyteller.
Data is the one tool that helps you hear what your students can’t find the words to say. When we listen to what the data is actually telling us, we stop guessing and start knowing. Data gives you the power to truly “see” a student and help them breathe a sigh of relief—or give a shout of joy. But only if the data is timely.
Moving Past the “Too Late” Numbers
For too long, the education world has treated data like an autopsy—a post-mortem look at a lesson that has already passed. We look at a Friday quiz score and see a “70%.” That number tells you a student is struggling, but it doesn’t give you the chance to help them succeed in the moment. By the time you see that 70%, the class has moved on, the weekend has happened, and that student may already be internalizing the feeling that they “just aren’t good at math.”
Benchmark data often works the same way. It can tell you what happened after the learning window has already closed, but it rarely helps you change the story while it is still being written. Real-time classroom data, by contrast, is instructionally useful in the moment. It gives teachers and leaders a chance to respond while support can still make an immediate difference—proving that one dedicated teacher can ignite curiosity when they have the right visibility.
Real-time classroom data is fundamentally different. It isn’t a backward-looking report card; it’s a live map of your classroom as it exists right now. It is the clearest pulse check you can get, showing you who is stuck while there is still time to help. Instead of waiting for failure to harden into frustration, this kind of instructional visibility allows you to reach out a hand while the outcome can still be changed.
That is the difference between being reactive and being proactive. It turns data from a judge into an advocate.
And for school leaders, the value goes beyond a single classroom. When this kind of timely, actionable data is available across classrooms, campuses gain instructional visibility that is otherwise impossible to achieve—aligning perfectly with the Data Wise improvement process used by high-performing leadership teams. Patterns become easier to spot. Support becomes easier to target. Instead of waiting for benchmark reports that arrive after the fact, leaders can begin to understand where learning is accelerating, where students are getting stuck, and where teachers may need reinforcements while there is still time to respond.
Reading the Story in Real Time
To stop the “I don’t get it” meltdown before it even starts, we need to think about data collection as the different chapters of a student’s story.
The “Right Now” Check (The Pulse)
This is your digital eyes and ears. As students work through lessons on instructional intelligence platforms like Classwork.com, you aren’t standing at the front of the room wondering who is actually making progress. You can see the pulse of the room in real time.
If a student has been stuck on the same step of a problem for four minutes, you get a signal. You do not have to wait for frustration to boil over. You can walk over right then, whisper a hint, and clear the hurdle before it becomes a behavioral issue. This is data at its most human. It is timely intervention fueled by empathy.
Imagine a student working through a multi-step math problem. On the surface, she looks quiet and compliant. But the live data shows she has attempted the same item three times and has not moved forward. Without that signal, she might sit there in silence until the lesson ends, carrying confusion with her into tomorrow. With it, the teacher can step in, notice that the misunderstanding is actually with integer signs, and give a 20-second clarification that changes the rest of the class period. That is not a spreadsheet. That is a student being seen.
The Progress Map (The Growth Story)
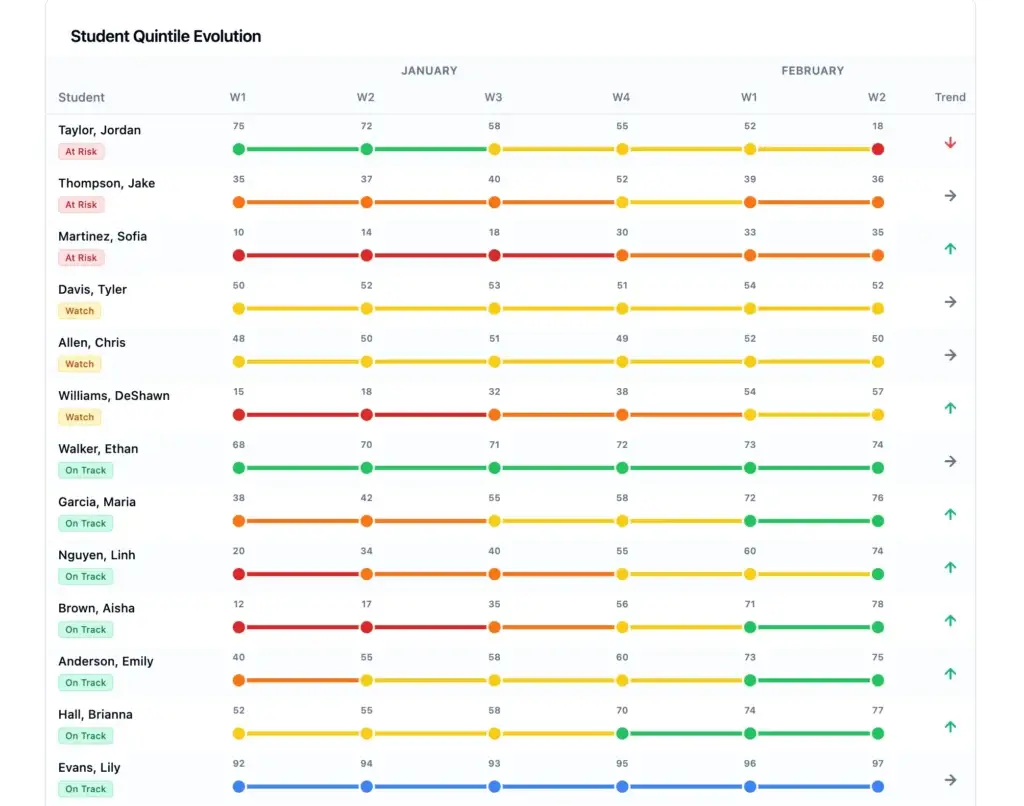
This is the chapter that builds over days and weeks. It tells you whether the plan you put in place is actually working. Are students starting to retain new skills, or are they slipping back into old habits? Are interventions helping? Is the class moving toward mastery, or just surviving each lesson?
This data acts like a growth chart, letting you see the height of understanding as it rises over time. It gives you actionable data for progress monitoring and allows you to pivot your strategy long before high-stakes testing season arrives. It helps ensure that no one quietly falls through the cracks of a long semester.
And when those growth stories can be viewed across classrooms, grade levels, or campuses, they become even more powerful. Teachers can refine instruction faster. Coaches can provide better support. Principals and district leaders can see where momentum is building and where extra attention is needed. The story becomes bigger than one child or one classroom, while still honoring each student inside it.
The Final Celebration (The Mastery Check)
We often call this “summative data,” but let’s call it what it really is: a celebration of mastery. This is the final verification that a student has reached the goal and is ready for the next level. It is the proof that all those small “Right Now” checks and progress maps worked.
It is the moment when a student realizes they didn’t just get through the work—they actually own the knowledge.
Why the “Right Now” Check Ends the Chaos
Every teacher knows the feeling of a classroom starting to slip into chaos. That tension is almost always rooted in unmet needs. When you have 25 students moving at 25 different speeds, and you’re the only one there to guide them, it’s impossible to be everywhere at once.
Without a clear signal, you are forced to guess where you’re needed most. Usually, that means you end up going to the loudest student first—the one who is acting out to get attention.
When you use the live storytelling of Classwork.com, you replace that guesswork with tactical awareness. You aren’t just managing a room; you are navigating it with a clearer strategy. Instead of reacting to the loudest flare-ups, you are identifying the sparks before they catch fire. It is about putting your energy where it will do the most good, rather than only where it is being demanded.
This doesn’t just help students. It saves your sanity.
It lowers the volume of the room because students feel seen and supported before they feel the need to vocalize their frustration through bad behavior. You aren’t just checking boxes. You are addressing the learning gap in the exact moment it forms.
That is what makes real-time data so different from benchmark fatigue. Benchmark data may tell you what happened. Real-time classroom data helps you do something about it.
Data Is Just Another Way to Care
At the end of the day, using data isn’t about chasing “90s” or “100s,” and it certainly isn’t about filling out charts for an administrator. It is about advocacy. It is about having the tools to hear what your students are saying through their effort, their pauses, their struggles, and their persistence.
When we look at a screen and see a student stalling, we aren’t seeing a failure. We are seeing a call for help. By using the live pulse of the classroom, you clear the path of frustration, reduce the chaos of the unknown, and ensure that every child—especially the quiet one—is truly seen and heard.
For teachers, that means more timely intervention and fewer missed signals. For school and district leaders, it means instructional visibility that travels beyond anecdote and isolated observations. It means being able to understand what is happening across classrooms in ways that are timely, practical, and useful—not just for accountability, but for support.
The Classwork.com mantra is simple: If they could tell you the problem, they would. Since they can’t, let the data be their voice.
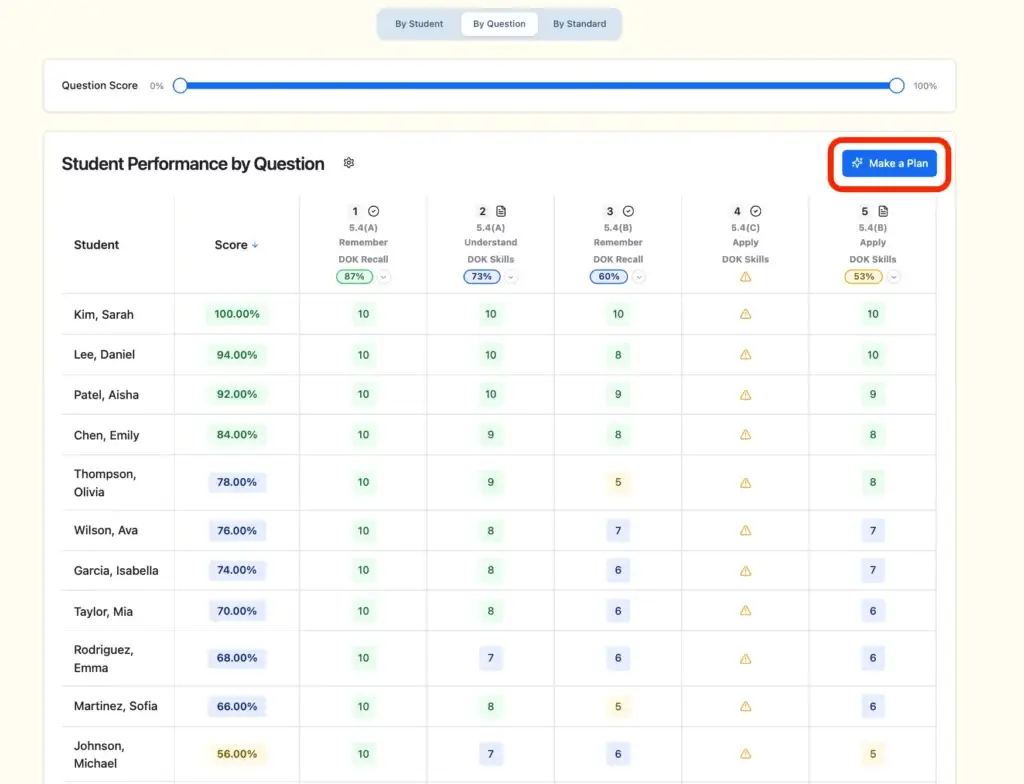
We remove the wall of numbers and present data in actionable formats. We provide flexible, customizable dashboards, interactive reports, data visualizations, and AI interpretations. Using our platform, teachers and instructional leaders can read each student’s story, in every classroom, in real time. We help you listen to what students are saying through their classwork, so you can respond sooner, support better, and help more of those stories end well.
Question 1: What is real-time classroom data?
Answer: Real-time classroom data is immediate information captured during a lesson that shows a student’s current progress, engagement, and roadblocks. Unlike benchmark testing, which looks backward at past performance, real-time data acts as a live map, allowing teachers to intervene in the exact moment a student gets stuck.
Question 2: How does real-time data differ from benchmark testing?
Answer: Benchmark testing is often “post-mortem” data that tells you what happened after a learning window has closed. Real-time classroom data provides instructional visibility while the learning is still happening. This allows for proactive support and immediate course correction before a student’s frustration turns into a behavioral issue.
Question 3: Why is instructional visibility important for school leaders?
Answer: Instructional visibility gives leaders a clear, objective view of what is happening across classrooms in real time. Rather than waiting for end-of-unit reports, leaders can use timely data to spot patterns, celebrate mastery, and target support or reinforcements to the teachers and students who need them most right now.
Question 4: Can data-driven instruction improve student engagement?
Answer: Yes. When teachers use real-time data to identify “quiet” struggles, students feel more seen and supported. By addressing learning gaps the moment they form, educators can reduce the “I don’t get it” meltdowns and lower classroom chaos, leading to a more positive and productive learning environment.
Ready to turn your classroom data into a storyteller?
Explore how Classwork.com provides the real-time insights you need to bridge the gap between teaching and learning.