
Which Instructional Approaches Truly Improve Learning
Evidence, Cost, and Reach
For more than thirty years, educators and policymakers have pursued instructional reforms intended to improve student achievement at scale. Many approaches such as Multi-Tiered Systems of Support (MTSS), adaptive learning technologies, daily data-driven instruction, and personalized learning have been widely implemented across schools and districts.
Yet these approaches vary greatly in both impact on student learning and cost to implement. Just as important, they also differ in the size of the student population they directly benefit. Some strategies are designed to serve every student in a classroom, while others target only the subset of students most in need of additional support.
This article provides a research-based survey of the most prominent instructional approaches, explains their effectiveness in terms of effect sizes (standard deviations), and compares them on dimensions of cost and audience reach.
Understanding Effect Sizes: What Standard Deviations Mean in Practice
Education researchers often measure the impact of interventions in standard deviations (SD). This allows comparisons across studies.
- 0.20 SD (small effect): About two months of additional learning in a school year.
- 0.40 SD (moderate effect): Roughly equivalent to half a year of additional learning.
- 0.50 SD (large effect): Impact is like moving a student from 50th percentile to 69th percentile
For context, the gap between grade levels is about 1.0 SD. Thus, a student who gains an extra 0.40 SD in achievement has closed nearly half the distance to the next grade’s average performance.
Detailed Review of Instructional Approaches
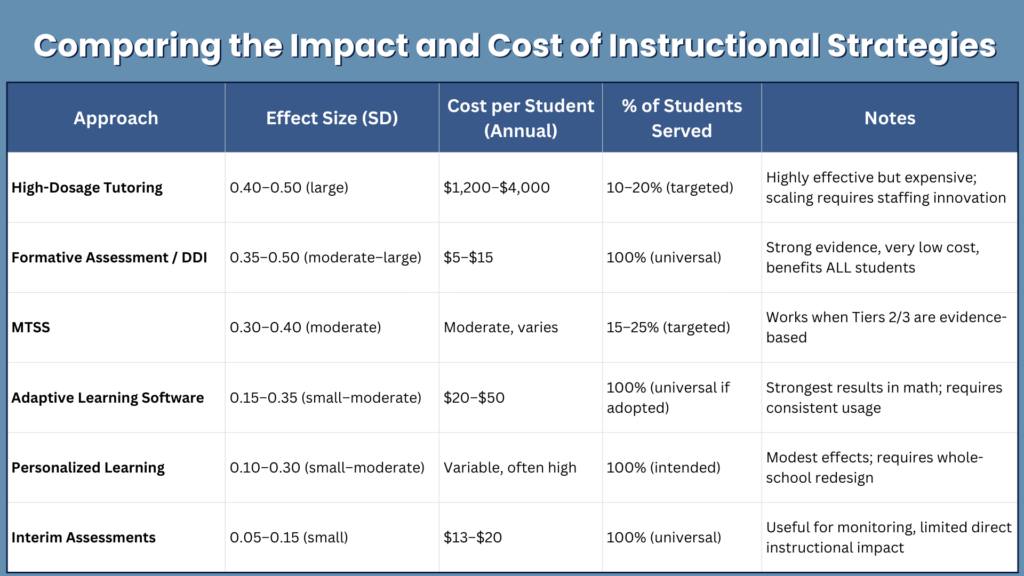
1. High-Dosage Tutoring
What it looks like in practice:
Students receive daily or near-daily tutoring in small groups (often 1:1 to 1:3). Sessions are built into the school day, often replacing electives or study periods. Tutors may be certified teachers, paraprofessionals, or trained volunteers, but programs with well-prepared staff and consistent scheduling see the strongest results.
Who it serves:
Typically 10–20% of students, especially those significantly below grade level. It is targeted rather than universal.
Evidence:
Meta-analyses show large effects, with impacts of 0.40–0.50 SD across subjects, particularly mathematics. A National Bureau of Economic Research review concluded tutoring is “one of the most effective interventions in education.”
Cost:
$1,200–$4,000 per student annually. Cost drivers include staffing, scheduling adjustments, and curriculum alignment.
Sources:
- Nickow, A., Oreopoulos, P., & Quan, V. (2020). The Impressive Effects of Tutoring on PreK-12 Learning. NBER. https://www.nber.org/papers/w27476
- EdResearch for Recovery. Design Principles for Effective Tutoring. https://edresearchforaction.com/sites/default/files/2021-02/ERA_Tutoring%20Design%20Principles.pdf
2. Formative Assessment and Daily Data-Driven Instruction (DDI)
What it looks like in practice:
Teachers embed short, low-stakes assessments into daily lessons—exit tickets, short quizzes, or quick checks for understanding. The results are reviewed immediately, allowing teachers to reteach concepts, regroup students, or provide feedback the next day (or even within the same class period).
Who it serves:
Every student in the classroom benefits from ongoing feedback cycles, making it a universal strategy.
Evidence:
Well-documented and consistently strong. John Hattie’s synthesis of over 1,200 meta-analyses identified feedback as one of the highest-impact factors in education, with an effect size of 0.70 SD. Black and Wiliam’s landmark work on formative assessment similarly demonstrated its strong impact.
Cost:
Minimal. Digital assessment tools typically cost $5–$15 per student per year. The main cost is professional learning to ensure teachers know how to interpret and act on the data.
Sources:
- Black, P., & Wiliam, D. (1998). Assessment and Classroom Learning. Assessment in Education, 5(1), 7–74. https://www.tandfonline.com/doi/abs/10.1080/0969595980050102
- Hattie, J. (2009). Visible Learning. Routledge.
3. Multi-Tiered Systems of Support (MTSS)
What it looks like in practice:
MTSS provides a structured framework for identifying and supporting students at risk academically or behaviorally. Tier 1 refers to high-quality instruction for all. Tier 2 provides supplemental small-group interventions. Tier 3 offers intensive, individualized supports. Schools screen all students multiple times per year and use data to assign students to tiers.
Who it serves:
While all students are screened, only about 15–25% typically receive Tier 2 or Tier 3 supports in a given year.
Evidence:
When implemented with fidelity, MTSS produces moderate gains (0.30–0.40 SD). However, results vary widely depending on the quality of interventions at Tiers 2 and 3 and the reliability of screening tools.
Cost:
Moderate. Requires staffing for intervention blocks, progress monitoring systems, and significant coordination among teachers and support staff. (Costs for training not included.)
Sources:
- McIntosh, K., & Goodman, S. (2016). Integrated Multi-Tiered Systems of Support. Guilford Press.
- RTI Action Network. https://www.rtinetwork.org/
4. Adaptive Learning Software
What it looks like in practice:
Students engage with digital software (such as i-Ready, DreamBox, or ALEKS) that adjusts the difficulty and sequence of problems based on their responses. These systems provide individualized pacing and immediate feedback.
Who it serves:
Potentially all students, though adoption is concentrated in mathematics and in elementary and middle schools.
Evidence:
Results are positive but smaller than tutoring or formative assessment, typically 0.15–0.35 SD. Gains are most consistent in mathematics, with weaker results in reading.
Cost:
$20–$50 per student per year, often purchased as site licenses. Costs are tied to platform subscriptions, hardware needs, and teacher training.
Sources:
- Pane, J. F., Steiner, E. D., Baird, M. D., & Hamilton, L. S. (2015). Continued Progress: Promising Evidence on Personalized Learning. RAND. https://www.rand.org/pubs/research_reports/RR1365.html
- Curriculum Associates. i-Ready Research and Efficacy. https://www.curriculumassociates.com/research-and-efficacy
5. Personalized Learning
What it looks like in practice:
Schools redesign structures to allow flexible pacing, student choice, and individualized pathways. This may involve competency-based progression, project-based work, or restructured schedules.
Who it serves:
Intended for all students, but implementation varies significantly across schools and classrooms.
Evidence:
RAND studies found modest improvements, especially in mathematics (0.10–0.30 SD), with smaller or negligible effects in reading. Implementation challenges and variation in fidelity reduce consistency.
Cost:
Variable and often high. Personalized learning often requires technology integration, new professional roles, and substantial teacher training.
Source:
- Pane, J. F., et al. (2015). Continued Progress: Promising Evidence on Personalized Learning. RAND. https://www.rand.org/pubs/research_reports/RR1365.html
6. Interim or Benchmark Assessments
What it looks like in practice:
Standardized tests given two to four times a year (e.g., NWEA MAP, district benchmarks) that predict performance on state exams and inform pacing decisions.
Who it serves:
Administered to all students, but the instructional value primarily depends on how teachers and administrators use the results.
Evidence:
Small impacts (0.05–0.15 SD). These assessments are valuable for accountability and monitoring but have limited direct impact on learning unless paired with structured instructional responses.
Cost:
$13–$20 per student per year. (Costs for assessment materials, staffing, training not included.)
Source:
Perie, M., Marion, S., & Gong, B. (2009). Moving Toward a Comprehensive Assessment System. ETS. https://files.eric.ed.gov/fulltext/ED543402.pdf
Comparative Analysis: Effectiveness, Cost, and Reach
Conclusion: Daily Data-Driven Instruction as the Most Cost-Effective Universal Strategy
When balancing effectiveness, cost, and audience size, one approach stands out: daily data-driven instruction supported by formative assessment and feedback.
- It produces moderate-to-large effects (0.35–0.50 SD).
- It is inexpensive to implement ($5–$15 per student annually).
- It benefits every student in the classroom, not just a subset.
High-dosage tutoring remains the most effective targeted intervention, but its high costs and limited reach make it impractical as a universal solution.
MTSS provides important support for struggling learners, but only serves a fraction of students.
Adaptive software and personalized learning show potential but yield smaller, less consistent gains. Interim assessments remain useful for accountability but do little to move learning outcomes on their own.
For districts seeking the most scalable and sustainable improvement, strengthening formative assessment cycles with immediate feedback should be a top priority.
It is the rare strategy that combines strong evidence, broad reach, and low cost.
Quick Summary & Common Questions
Which instructional approach has the highest impact on student learning? Research shows that High-Dosage Tutoring and Formative Assessment (Daily Data-Driven Instruction) yield the highest results, with effect sizes ranging from 0.40 to 0.70 standard deviations. While tutoring is a powerful targeted intervention for the bottom 10-20% of students, Formative Assessment is considered the most effective universal strategy, benefiting 100% of students with significant academic gains.
What do “Standard Deviations” mean when measuring student growth? In education research, standard deviations (SD) quantify the impact of an intervention. A 0.20 SD is a small effect (about two months of extra learning), while a 0.50 SD is a large effect, equivalent to moving a student from the 50th to the 69th percentile. For context, the gap between entire grade levels is typically about 1.0 SD.
How does High-Dosage Tutoring compare to Adaptive Learning software? High-Dosage Tutoring is significantly more effective but much costlier, with effect sizes of 0.40–0.50 SD and costs up to $4,000 per student. Adaptive Learning software (like i-Ready or DreamBox) is more scalable and affordable at $20–$50 per student, but it yields smaller gains, typically between 0.15 and 0.35 SD, with the most consistent results seen in mathematics.
Why is Daily Data-Driven Instruction (DDI) considered the most cost-effective strategy? Daily DDI stands out because it combines moderate-to-large academic effects (0.35–0.50 SD) with a very low implementation cost of $5–$15 per student. Unlike targeted interventions like MTSS or tutoring, DDI is a universal strategy that improves outcomes for every student in the classroom by using immediate feedback cycles and exit tickets to guide instruction.