Turn Pictures Into Digital Map Pins
Felt.com is a digital mapping tool that launched late last year and has since impressed me with both its ease of use and its plentiful features. The latest feature added to Felt that I really like is the option to take any of your pictures and use them as placemarkers or pins on your maps. […]
45 Digital Mapping Tutorials
This month I’ve been spending some time organizing the tutorial videos on my YouTube channel. To that end I’m creating playlists that are organized thematically. The latest playlist that I’ve created is titled Digital Mapping. The playlist currently contains 45 tutorial videos covering more than just Google Maps. In the playlist you’ll find tutorials on […]
Maps and Videos About Where Thanksgiving Foods Come From

Where Does Your Thanksgiving Dinner Come From? is an interactive storymap that I’ve shared in the past and still find interesting. The map displays where eight popular Thanksgiving foods are grown and harvested in the United States. The storymap includes a map for each ingredient. Each map shows the locations of commercial producers. Fun facts are […]
Getting Started With Padlet – What You Need to Know

Padlet is a tool that I’ve been using and recommending to others for more than a decade. I started using it back when it was known as Wall Wisher. I often used it to create digital KLW charts with my U.S. History students. Over the years Padlet has evolved by adding more features, updates to […]
Create Animated Maps on Mult Dev – One of My New Favorites in 2021

I’m taking this week to recharge and get ready for the next session of the Practical Ed Tech Virtual Summer Camp. For the next few days I’m going to highlight some of my favorite new and new-to-me tools so far this year. Mult Dev is a free tool that lets you quickly create animated maps. In the time […]
Roadside America in a Story Map

The Library of Congress houses the John Margolies Roadside America Photograph Archive. That archive contains nearly 12,000 photographs of interesting roadside attractions all over the United States and eastern Canada. The collection includes pictures of things like gas stations shaped like a dinosaur, windmills that serve as ice cream stands, funky miniature golf courses, and […]
Mult.dev – A New Way to Quickly Make an Animated Map

Mult.dev is a new mapping tool that I recently learned about through Maps Mania. Mult.dev does just one thing but does it very well. That thing is create animated maps illustrating the connections and travel distance between two or more places. To create an animated map on Mult.dev you do not need an account. You […]
Three Good Options for Drawing on Digital Maps

Creating layers and tours in Google Earth and Google My Maps can be a great way for students to assemble collections of geolocated information to summarize research, create a book tour, or even develop safe walking and biking routes. But sometimes you just need to quickly draw or pin things to a digital map. In […]
Virtually Explore America’s Quietest Roads

America’s Quietest Roads is an interactive map created by a road traffic analytics company called Geotab. The map features the quietest state or federal highway in all fifty states. They define quietest as having the least average number of vehicles traveling the road throughout the year 2015. It’s important to point out to students that […]
Cronobook – A Map of Historical Photographs

Cronobook is a new-to-me website that features a searchable map of historical photographs. The premise of the site is simple and using it is easy. Just head to the site, search for a location, and click on the small images to see them in full size. A little bit of information including location and […]
Movies on Map – Discover the World Through a Map & Video Combination

I love maps and I love a good video so I had to explore Movies on Map when I saw it featured on Maps Mania. Movies on Map is a site that features videos about interesting places all over the world. You can search for a video according to location on Movies on Map or […]
White Christmas Probability Map

My daughters are excited about Christmas being just nine days away. They were also a little sad that all of the snow melted over the weekend. Fortunately, the odds are in our favor that we will have snow on the ground again before Christmas. I know that from experience and from consulting NOAA’s Probability of […]
Collaboratively Create Maps on Padlet

Padlet has been in my list of top collaboration tools for nearly a decade. I started using it with my students back when it was still known as Wallwisher. There are many ways to use Padlet from simply providing a place to share text notes to using it as a place to collect video samples […]
A Classic Geography Tool – Overlap Maps

As I mentioned on the latest episode of The Practical Ed Tech Podcast, last week I was reminded of a great little geography site called Overlap Maps. I hadn’t used it in a long time so I went to see if it was still functioning as it did when I was regularly using it seven […]
8 Options for Making Digital Maps
In yesterday’s post about English Heritage’s Map of Myth, Legend, and Folklore I included a mention of using StoryMap JS to create interactive maps. That prompted a response from Cindy Rudy who suggested the idea of using Thinglink or Google Earth to make similar maps of myths, legends, and folklore. That was my inspiration for this […]
Mapping the Ingredients in Thanksgiving Meals

Last year on Thanksgiving I discovered an ESRI Storymap titled Where Does Your Thanksgiving Dinner Come From? Of course, having discovered it on Thanksgiving Day it was a bit too late to be useful so I’m sharing it again this year in advance of Thanksgiving. Where Does Your Thanksgiving Dinner Come From? displays where eight […]
Turn CSV Files Into Heat Maps

Heat Map Tool is a tool for easily creating heat maps or incident maps from a CSV file. To create a heat map all you need to do is upload a CSV file then specify your desired display attributes like scale, colors, and opacity. You can edit the display attributes of your map whenever you like. If […]
5 Tutorials on Mapping Stories
In Wednesday’s broadcast of Practical Ed Tech Live I answered a question from a reader who was looking for advice on how to have students create maps based on stories that students read. The person had seen it done at a Google Apps Summit but couldn’t remember the name of the tool(s) that was used. […]
Historical Patterns Animated
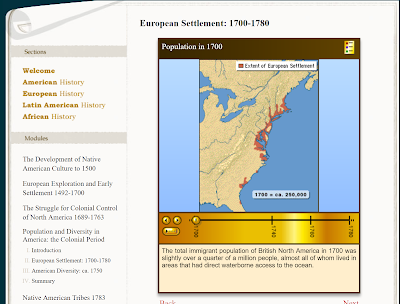
Some of my favorite social studies lesson plans included having students use maps to analyze data and identify patterns in history. Over the years I’ve done this with paper maps and digital maps. One neat digital map source is Mapping History which is produced by the University of Oregon that features animated maps illustrating problems, […]
World Population Trends – Interactive Map & Guiding Questions
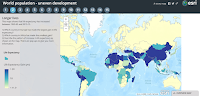
World Population Trends is an interactive story map series produced on the ESRI platform. Fifteen maps in the series show patterns of change in the world’s population from 1960 through 2015. The maps in the series represent population changes due to birth and death rate changes, life expectancy changes, fertility rate changes, and changes in […]
Explore Maps of Historical Sites in Every U.S. State
The Traveling Salesman Problem is a website developed by William Cook at the University of Waterloo. The site features interactive maps that chart the short distance between a series of places. One of those maps is of all of the places in the United States National Register of Historic Places, all 49,603 of them.You can […]
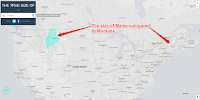
These Tools Help Students Compare the Sizes of States & Countries

I’m in Scottsbluff, Nebraska this morning. On Friday I drove from Denver to Cheyenne to Scottsbluff. Making that drive reminds me that Maine is quite small in comparison to western states. While it’s hard to replicate the experience, there are tools that help students see the size of states and countries relative to others. The […]
11 Video Tutorials About Creating Multimedia Maps
Next week is Geography Awareness Week. That is a great time to have your students create their own multimedia maps. Yesterday, I shared five map creation activities that your students can do to increase their understanding of geography. In that post I suggested using Google’s My Maps, Scribble Maps, and National Geographic’s Map Maker Interactive […]
5 Map Creation Activities for Geography Awareness Week
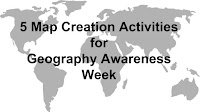
Next week is Geography Awareness Week. As a social studies teacher I think every week should be Geography Awareness Week, but I digress. Looking at maps is fine, making maps is better. Here are five map creation activities that your students can do to increase their understanding of geography. 1. Create a map of a […]
5 Types of Stories Students Can Tell With Digital Maps
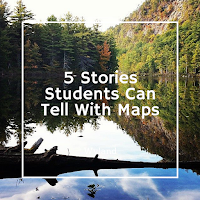
When most teachers hear or read about Google Maps, Google Earth, ESRI, and other digital mapping tools they tend to think about social studies topics. While digital mapping tools are perfectly suited to social studies lessons, they can also be used in other subject areas including math, language arts, and science. Here are five types […]
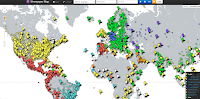
Three Ways for Students to Compare the Sizes of Countries and States
My students here in Maine always think of our state as being a big place and it is relative to the rest of New England. Compared to our friends in the west, Maine is a small place. Similarly, they sometimes have trouble understanding the size of the lower 48 states compared to Canada. The following […]
Four Ways to Explore the News Through Maps
One of the things that I like about CNN Student News is that it almost always includes a map to show students where a story is taking place in the world. I try to do the same whenever I teach current events by showing students a map of where a story takes place. It can […]