Five Digital Mapping Tools That Aren’t Made by Google

Google Earth and Google’s My Maps are great tools for students to use to create multimedia maps. But Google isn’t the only game in town when it comes to digital map creation tools. In fact, there are some good ones that are freely available to you and your students outside of what Google offers. Here’s […]
An Interactive Map of Surnames in Ireland

Mapping the Emerald Isle: a geo-genealogy of Irish surnames is an interactive map depicting the distribution of Irish surnames across Ireland according to the 1890 census. To use the same simply select a name from a drop-down menu in the list and the map will change to show you in which counties people with that […]
Mapping Where Food Comes From

Where Does Your Thanksgiving Dinner Come From? is an interactive storymap that I’ve shared in the past and still find to be a neat resource. The map displays where eight popular Thanksgiving foods are grown and harvested in the United States. The storymap includes a map for each ingredient. Each map shows the locations of commercial […]
Roadside America in a Story Map

The Library of Congress houses the John Margolies Roadside America Photograph Archive. That archive contains nearly 12,000 photographs of interesting roadside attractions all over the United States and eastern Canada. The collection includes pictures of things like gas stations shaped like a dinosaur, windmills that serve as ice cream stands, funky miniature golf courses, and […]
A Couple of Lessons on the Origins of Thanksgiving Foods

A couple of weeks ago I published a blog post in which I shared an ESRI Story Map of where traditional Thanksgiving foods are grown today in the United States. That story map covers where food comes from today, but it doesn’t cover this historical origins of traditional Thanksgiving foods. That’s an interesting topic of […]
Five Tools for Telling Stories With Maps

One of my favorite alternatives to traditional book report assignments is having students create multimedia maps based on books they’ve read. Google Lit Trips first made that idea popular more than a decade ago. Of course, creating a multimedia map is also an excellent way for students to summarize and geo-locate a series of related […]
White Christmas Probability Map

My daughters are excited about Christmas being just nine days away. They were also a little sad that all of the snow melted over the weekend. Fortunately, the odds are in our favor that we will have snow on the ground again before Christmas. I know that from experience and from consulting NOAA’s Probability of […]
Mapping Thanksgiving

Where Does Your Thanksgiving Dinner Come From? is an interactive storymap that displays where eight popular Thanksgiving foods are grown and harvested in the United States. The storymap includes a map for each ingredient. Each map shows the locations of commercial producers. Fun facts are included in the storymap too. For example, did you know that […]
Camera and Locomotive – A Mapped Story About the Transcontinental Railroad
Camera and Locomotive is the title of a fantastic mapped story published by the Library of Congress. Camera and Locomotive tells the story of the building of the Transcontinental Railroad and the development of photography in the United States. As you scroll through the story you will find interactive maps that are loaded with photographs […]
Zip Tapestry – Demographic Data and More, Mapped

Zip Lookup is an interesting use of the ESRI mapping platform. The map allows you to enter any US zip code to discover demographic data about that area. Whenever I see something like this I am skeptical of how well it will work for very small towns like the one that I live in (South Paris, […]
Mapping the Ingredients in Thanksgiving Meals

Last year on Thanksgiving I discovered an ESRI Storymap titled Where Does Your Thanksgiving Dinner Come From? Of course, having discovered it on Thanksgiving Day it was a bit too late to be useful so I’m sharing it again this year in advance of Thanksgiving. Where Does Your Thanksgiving Dinner Come From? displays where eight […]
Mapping the Thanksgiving Harvest

Where Does Your Thanksgiving Dinner Come From? is the title of an Esri Storymap. The storymap displays where eight popular Thanksgiving foods are grown and harvested in the United States. The storymap includes a map for each ingredient. Each map shows the locations of commercial producers. Fun facts are included in the storymap too. For […]
World Population Trends – Interactive Map & Guiding Questions
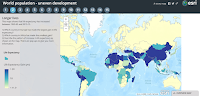
World Population Trends is an interactive story map series produced on the ESRI platform. Fifteen maps in the series show patterns of change in the world’s population from 1960 through 2015. The maps in the series represent population changes due to birth and death rate changes, life expectancy changes, fertility rate changes, and changes in […]
Peaks and Valleys – An Interactive Story Map
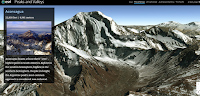
Peaks and Valleys is an interactive story map produced on the ESRI platform. As you scroll through the story map the highest peaks and lowest valleys on each continent are revealed in 3D renderings. As you scroll through the 3D imagery a sidebar pops-up. That sidebar contains a photograph of the peak or valley and […]
5 Types of Stories Students Can Tell With Digital Maps
When most teachers hear or read about Google Maps, Google Earth, ESRI, and other digital mapping tools they tend to think about social studies topics. While digital mapping tools are perfectly suited to social studies lessons, they can also be used in other subject areas including math, language arts, and science. Here are five types […]
Mapping the Emerald Isle – An Interactive Map of Surnames in Ireland

Happy St. Patrick’s Day! Today, is a perfect day to share a neat interactive story map produced by ESRI. Mapping the Emerald Isle: a geo-genealogy of Irish surnames is an interactive map depicting the distribution of Irish surnames across Ireland according to the 1890 census. To use the same simply select a name from a […]