A Good Tool for Mapping Census Data
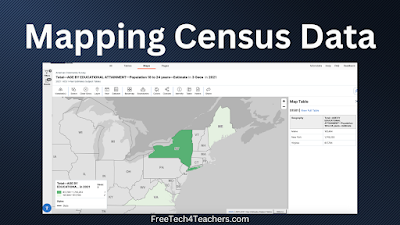
Earlier today I was looking for a dataset that I could use in a new data visualization tool that I’m testing out. That quest took to me the website of the U.S. Census Bureau. It was there that I went down a rabbit hole of looking at data. Eventually, I stumbled into a mapping tool […]
Turn Pictures Into Digital Map Pins
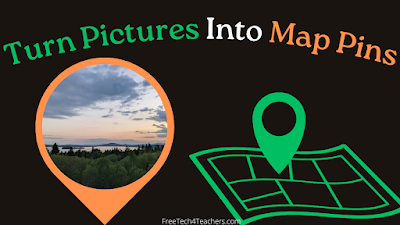
Felt.com is a digital mapping tool that launched late last year and has since impressed me with both its ease of use and its plentiful features. The latest feature added to Felt that I really like is the option to take any of your pictures and use them as placemarkers or pins on your maps. […]
48 Digital Mapping Tutorials
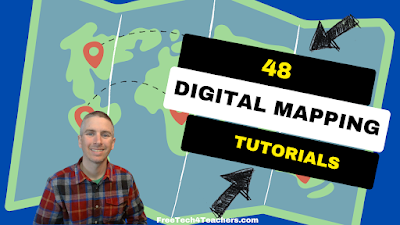
Even though I write a lot about Google Earth and Google Maps, there is more to digital mapping than just using those tools. In fact, there are some great digital mapping tools not made by Google that students can use to create things like historic map overlays, map and timeline combinations, and map-based stories. In […]
Projection Wizard – See How Maps Distort the World

Projection Wizard is an interesting tool developed by Bojan Šavrič at Oregon State University. The purpose of Projection Wizard is to help cartographers select the best map projections for their projects. To use the Projection Wizard select a distortion property from a menu appearing to the left of the map. Then use the highlighting tool […]
Learning About Languages and The Mysteries of Vernacular

Last week I wrote a blog post titled Two Lessons for a Wicked Cold Day. After publishing that post it occurred to me that readers who are not familiar with New England may be wondering why I chose the word wicked. Sure enough, someone emailed me last night to ask what I meant by “wicked […]
How to Map Spreadsheet Data on Felt
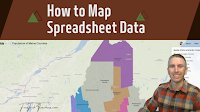
Felt is a multimedia mapping tool that I started using late last year and it has quickly become one of my favorite mapping tools. With Felt you can create everything some simple directions maps to maps that have historic overlays to maps of animal migrations and much more. The latest update to Felt makes it […]
A New Felt Mapping Tool
A few days ago I shared a neat map of gray whale migration patterns. That map was created on the Felt mapping platform. Felt was one of my favorite new tools of 2022 and is only getting better at the start of 2023. The most recent update to Felt introduced an easier way to access […]
Gray Whale Migration and More Felt Mapping Ideas

Felt is a multimedia mapping tool that I started using late last year. It has quickly become one of my preferred tools for creating multimedia maps. In fact, at this point I think I like more than Google’s My Maps. The aesthetics of Felt are great and it has a great selection of easy-to-use features. […]
How to Create Map Overlays
Felt was one of my favorite new tools in 2022. In fact, I liked it so much that I included it in my Best of the Web for 2022. Felt is a free multimedia mapping tool that I think is easier for first-time users to use than Google’s My Maps or ESRI’s mapping tools. Right […]
Two Cool Mapping Tools in the Felt Mapping Platform

A couple of weeks ago I published an introductory overview of a new digital mapping platform called Felt. As I said in that introduction, I’ve only begun to scratch the surface of all of the things that students can do and make on Felt. One of those things is the ability to quickly and easily […]
How to Create a Story Map

StoryMap JS is a tool that I’ve been using and recommending for many years. It’s a free tool that students can use to create a story map in a manner similar to Google’s My Maps or the old Google Tour Builder. The difference between those tools and StoryMap JS is that StoryMap JS is much […]
Felt – A New Way to Create Multimedia Maps

About a week ago Larry Ferlazzo mentioned a new mapping tool in one of his blog posts. That tool is called Felt. I tried it a few days ago and I have to say that I like it a lot. Felt offers a lot of easy-to-use tools for creating custom maps. Some of the features […]
How to Create a Digital Map Collection in Wakelet

Wakelet is a free, collaborative bookmarking and file organization tool that puts things into a nice visual display. So when a former colleague emailed me a couple of days ago to ask for help creating a collection of digital maps Wakelet was one of the first tools to come to mind (Padlet was the other). […]
Scribble Maps – Draw on Google Maps and More Without an Account

To close out Geography Awareness Week 2021 I have one more cool tool to share. Scribble Maps is a tool that I’ve used and recommended for years. As the name implies, you can use it to draw on maps. You can also use it to create multimedia map markers. The best part is that you […]
Mapping Where Food Comes From

Where Does Your Thanksgiving Dinner Come From? is an interactive storymap that I’ve shared in the past and still find to be a neat resource. The map displays where eight popular Thanksgiving foods are grown and harvested in the United States. The storymap includes a map for each ingredient. Each map shows the locations of commercial […]
The Living Atlas of the World

The ArcGIS Living Atlas of the World is a collection of thousands of online, interactive maps representing all kinds of data. The contents of the collection range from relatively simple displays of historical map imagery to complex, displays of data updated nearly live. For example, this map displays active hurricanes, cyclones, and typhoons. Another good […]
Getting Started With Padlet – What You Need to Know

Padlet is a tool that I’ve been using and recommending to others for more than a decade. I started using it back when it was known as Wall Wisher. I often used it to create digital KLW charts with my U.S. History students. Over the years Padlet has evolved by adding more features, updates to […]
How to Create Custom Coloring Maps

There are plenty of places on the Internet to find free outline maps of states, provinces, countries, and regions of the world. Finding blank outline maps of cities, small towns, or neighborhoods is a little harder to do. If you’re looking for a blank map of a city, town, or neighborhood for your students to […]
Great Reads from Great Places – An Interactive Map from the Library of Congress

Great Reads from Great Places is an interactive map produced by the Library of Congress for the National Book Festival. The purpose of the map is twofold. First, to help visitors find National Book Festival-related events in their states. Second, to help visitors find books that are connected to their states. Those connections could be […]
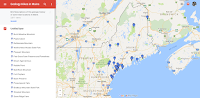
An Interactive Map of Historical Sites in Every U.S. State

The Traveling Salesman Problem is a website developed by William Cook at the University of Waterloo. The site features interactive maps that chart the short distance between a series of places. One of those maps is of all of the places in the United States National Register of Historic Places, all 49,603 of them.You can […]
Create Animated Maps on Mult Dev – One of My New Favorites in 2021

I’m taking this week to recharge and get ready for the next session of the Practical Ed Tech Virtual Summer Camp. For the next few days I’m going to highlight some of my favorite new and new-to-me tools so far this year. Mult Dev is a free tool that lets you quickly create animated maps. In the time […]
How to Quickly Create Animated Maps

A couple of weeks ago I wrote about new mapping tool called Mult Dev. It’s a free tool that lets you quickly create animated maps. In the time since I wrote about Mult Dev a couple of updates were made to it. The most notable of those being that you now need to sign into […]
A Math and Map Challenge

This evening while recording Two Ed Tech Guys Take Questions & Share Cool Stuff I was reminded of a neat math and map challenge activity from Mathigon. Here’s what I wrote about it last year. Mathigon’s map coloring challenge is to use as few colors as possible to color in all 50 U.S. states without the […]
Mult.dev – A New Way to Quickly Make an Animated Map

Mult.dev is a new mapping tool that I recently learned about through Maps Mania. Mult.dev does just one thing but does it very well. That thing is create animated maps illustrating the connections and travel distance between two or more places. To create an animated map on Mult.dev you do not need an account. You […]
What is a Map? – And a New Crash Course in Geography

For as long as I can remember I’ve enjoyed looking at maps. Whether it’s a standard Mercator projection printed on paper or a digital map, looking at maps sparks curiosity in my brain. I’m certain that’s why I always enjoyed teaching geography and why I spend so much time today teaching others how to use […]
A Couple of Lessons on the Origins of Thanksgiving Foods

A couple of weeks ago I published a blog post in which I shared an ESRI Story Map of where traditional Thanksgiving foods are grown today in the United States. That story map covers where food comes from today, but it doesn’t cover this historical origins of traditional Thanksgiving foods. That’s an interesting topic of […]
Scribble Maps – Create Multimedia Maps – No Account Required

Earlier this week I presented a webinar about using Google Maps and Earth for more than just social studies lessons. A follow-up email that I received came from a teacher who wanted to know if there was a way for her students to create multimedia maps without needing to sign into a Google account. My […]
How to Create Labeling Activities With Google Drawings and Classroom

Last week I hosted a webinar for a group that I’m working this summer. One part of that webinar included making online activities for students. I included some of the typical things like Kahoot and Wizer but I also included a demonstration on how to use Google Drawings to make online labeling activities. In the […]
Quickly Create Collaborative Maps With Ethermap

Google’s My Maps tool is great for students to use to collaborate on the creation of custom maps. The problem with it is that students must have Google accounts in order to use it. Ethermap solves that problem by not requiring users to have any kind of email account. Ethermap is a new tool that […]
Three Ways to Collaboratively Create Multimedia Maps
With Padlet’s new multimedia mapping tool and the recent update to the web version of Google Earth there are more ways than ever for students to collaborate on creating multimedia maps. The three collaborative multimedia mapping tools that I’m going to recommend to most people for the foreseeable future are Google’s My Maps, Padlet, and […]
How to Create a Multimedia Map on Padlet

Last week I shared the news that Padlet now includes multimedia map creation options. Like all other Padlet layouts, the map option includes the capability to collaborate. The maps that you create on Padlet can have placemarkers that include pictures, videos, links, text, and audio files. You can even record audio and video within the […]
Zip Tapestry – Demographic Data and More, Mapped

Zip Lookup is an interesting use of the ESRI mapping platform. The map allows you to enter any US zip code to discover demographic data about that area. Whenever I see something like this I am skeptical of how well it will work for very small towns like the one that I live in (South Paris, […]
5 Ways to Tell Stories With Maps
Maps can be great tools for supporting nonfiction and fiction stories. Being able to see the greater context of a location can go a long way toward helping students see the complete overview of a story. This can be helpful for learning about historical events, for supporting biographies, or for seeing the settings of fiction […]
Turn CSV Files Into Heat Maps

Heat Map Tool is a tool for easily creating heat maps or incident maps from a CSV file. To create a heat map all you need to do is upload a CSV file then specify your desired display attributes like scale, colors, and opacity. You can edit the display attributes of your map whenever you like. If […]
World Population Trends – Interactive Map & Guiding Questions
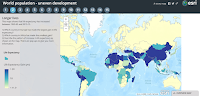
World Population Trends is an interactive story map series produced on the ESRI platform. Fifteen maps in the series show patterns of change in the world’s population from 1960 through 2015. The maps in the series represent population changes due to birth and death rate changes, life expectancy changes, fertility rate changes, and changes in […]
A Great Example of Using Google Maps in Science
At almost every conference that I attend I offer a session about Google Maps and Google Earth. Most of the people that come to those sessions are social studies teachers. That is because there is a natural connection between maps and topics in social studies. But there are plenty of other subject areas and topics […]
5 Types of Stories Students Can Tell With Digital Maps
When most teachers hear or read about Google Maps, Google Earth, ESRI, and other digital mapping tools they tend to think about social studies topics. While digital mapping tools are perfectly suited to social studies lessons, they can also be used in other subject areas including math, language arts, and science. Here are five types […]
27 Ideas for Teaching With & About Topographic Maps

The USGS offers free topographic maps for most of the United States. The maps can be downloaded as PDFs through the USGS store. The maps can be used in the 27 suggested topographic maps lessons found in the USGS education site. All of the lessons are rated by grade level and time required for completing […]
Four Ways to Explore the News Through Maps
One of the things that I like about CNN Student News is that it almost always includes a map to show students where a story is taking place in the world. I try to do the same whenever I teach current events by showing students a map of where a story takes place. It can […]
Mapping the Emerald Isle – An Interactive Map of Surnames in Ireland

Happy St. Patrick’s Day! Today, is a perfect day to share a neat interactive story map produced by ESRI. Mapping the Emerald Isle: a geo-genealogy of Irish surnames is an interactive map depicting the distribution of Irish surnames across Ireland according to the 1890 census. To use the same simply select a name from a […]
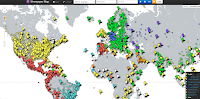
Students Can Compare Maps Side-by-Side in GE Teach
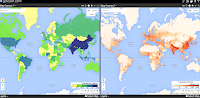
GE Teach is a great map tool that I last featured about 18 months ago. GE Teach is developed and maintained by a high school teacher in Texas named Josh Williams. We had the chance to meet at TCEA this week and chat about GE Teach. GE Teach has gone through a bunch of iterations […]
Three Thematic Mapping Tutorials
This morning on the Free Technology for Teachers Facebook page I received a question from someone seeking a thematic mapping tool that her students can use. My initial thought was to use Google’s My Maps tool. Recognizing that not everyone is in love with Google products, I will also frequently suggest using National Geographic’s Map […]